EN
EN DE
DE ES
ES FR
FR NL
NL PT
PT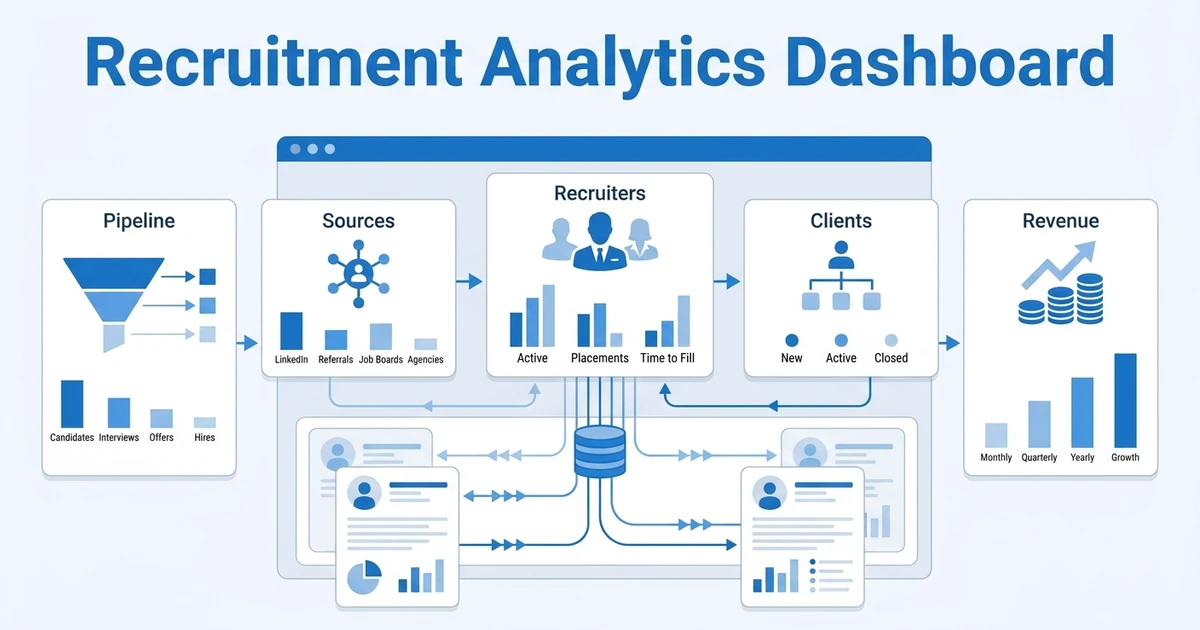
Quick Answer: Agency Dashboard
A recruitment analytics dashboard is a live view of the metrics that show where your hiring process is moving, slowing, or leaking revenue. For agencies, the best dashboard tracks pipeline conversion, time in stage, source quality, recruiter output, client response speed, and placement revenue from one ATS and CRM dataset.
If your dashboard only shows how many calls your team made, it is not helping you run the agency. It is showing motion, not progress.
A useful dashboard connects recruiter work to business outcomes. It helps you see which jobs are aging, which clients are slow to respond, which sources produce interview-ready candidates, and which recruiters need coaching or capacity relief.
This is where many agency dashboards fall short. They report what happened after the damage is done. The better approach is to build a dashboard that flags the next decision your team should make.
What Should a Recruitment Analytics Dashboard Show?
Your dashboard should show the few metrics that help you improve speed, quality, client service, and revenue. It should not become a storage shelf for every field your Applicant Tracking System (ATS) can export.
For agencies, the dashboard needs to reflect the full commercial workflow. That means your data should connect job orders, candidates, clients, recruiter activity, pipeline movement, placements, and revenue. Gartner describes modern talent acquisition suites as combining candidate relationship management, applicant tracking, onboarding, analytics, reporting, and AI capabilities, which is a useful reminder that hiring data works best when it is connected Gartner, 2026.
At a minimum, your dashboard should answer these questions:
- Which jobs are moving and which are stuck?
- Which recruiters are producing qualified progress, not just activity?
- Which sources create interviews, offers, and placements?
- Which clients delay feedback or reject too many submissions?
- Which roles are putting revenue at risk?
The reason this matters is simple. AI and automation are pushing more work into recruiting systems. SHRM reports that AI use in HR tasks rose to 43% of organizations in 2025, up from 26% in 2024 SHRM, 2025. When more workflow happens inside software, your dashboard becomes the agency’s operating console.
Recruitment Analytics Dashboard KPIs Agencies Should Track
The strongest recruitment KPI dashboard separates signal from noise. A high number of sourced candidates can look impressive, but it means little if none of those candidates reach interview.
Use KPIs that expose movement through the funnel and the quality of that movement. A metric is useful when it leads to a coaching conversation, a client escalation, a sourcing adjustment, or a process change.
| KPI Area | Metric To Track | What It Tells You | Action It Should Trigger |
|---|---|---|---|
| Pipeline health | Time in stage | Where candidates or jobs are stuck | Chase feedback, adjust workflow, or reset expectations |
| Source quality | Source-to-interview conversion | Which channels create qualified candidates | Shift spend and recruiter time toward better sources |
| Recruiter output | Qualified submissions per role | Whether effort is creating client-ready profiles | Coach on qualification or rebalance workload |
| Client responsiveness | Time to client feedback | Whether clients are slowing placements | Escalate account follow-up or set SLA rules |
| Revenue visibility | Placement value by open job | Which roles deserve priority | Focus capacity on higher-value work |
The goal is not to track everything. The goal is to track enough to make better weekly decisions.
For example, if one job has many submissions but no interviews, the problem may be intake quality, salary mismatch, or client expectations. If another job has strong interview conversion but slow offer movement, the bottleneck sits later in the process.
Which Metrics Belong on Recruiter, Manager, and Leadership Dashboards?
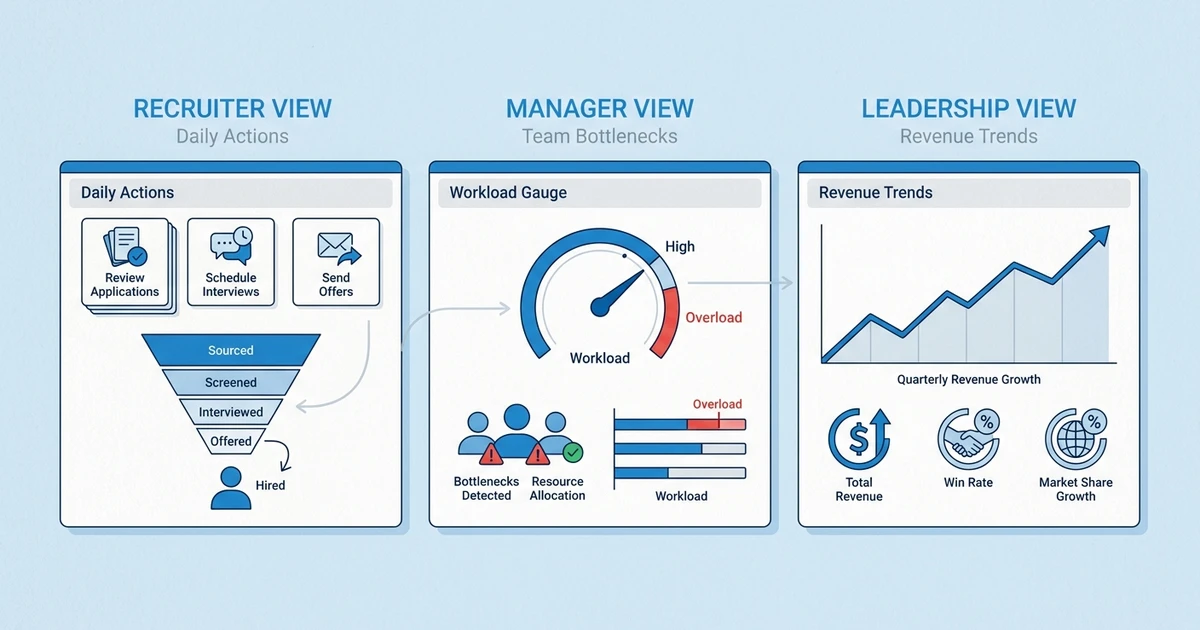
Not every person needs the same dashboard. A recruiter needs daily action cues. A manager needs team-level bottlenecks. Leadership needs capacity, client, and revenue visibility.
When everyone sees the same crowded dashboard, nobody knows what to fix. Split the view by role so each person gets metrics they can actually influence.
| Dashboard Layer | Best Metrics | Owner | Primary Decision |
|---|---|---|---|
| Recruiter view | Today’s follow-ups, candidates in stage, response rate, interviews booked | Recruiter | What should I move today? |
| Manager view | Submittal quality, stage aging, recruiter workload, client feedback delays | Team lead | Who needs coaching or support? |
| Leadership view | Fill rate, revenue forecast, source ROI, client account health | Owner or director | Where should the agency invest time? |
Recruiter dashboards should stay close to action. A recruiter does not need a boardroom report at the start of the day. They need to know which candidate needs a call, which client owes feedback, and which job order is aging.
Leadership dashboards should show trends that affect margin and growth. If a major client has a poor interview-to-placement ratio, that is not just a recruiting issue. It is a commercial issue.
How to Build a Recruitment KPI Dashboard Without Spreadsheet Chaos
Spreadsheet dashboards often start well and then slowly become fragile. One person owns the formulas. Another person forgets to update source data. A third person changes a stage name, and the entire report becomes suspect.
The better approach is to build your dashboard from live workflow data. Your ATS and CRM should capture the stage changes, recruiter actions, client feedback, and placement outcomes your dashboard needs.
Start with a simple build sequence:
- Define the decisions the dashboard should support.
- Standardize your pipeline stages across the agency.
- Clean your source labels so reporting is not split across duplicate names.
- Decide which metrics belong to recruiters, managers, and leadership.
- Review the dashboard on a fixed rhythm.
This rhythm keeps reporting connected to action. If your team reviews source quality every week, recruiters will care about tagging sources correctly. If nobody reviews the data, the data gets messy.
Midway through the build, check whether your system can connect candidate, client, and revenue data. ATZ CRM’s recruitment reports and dashboards help agencies track recruiting activity, goals, pipeline movement, and performance in one place, so managers are not stitching reports together after the fact.
Recruitment Metrics Dashboard: What to Automate First
Automation should remove reporting admin before it adds more reporting complexity. If your team has to update a spreadsheet after updating the ATS, your dashboard is already costing too much.
The first automation priority is stage movement. When a candidate moves from submitted to interviewed, that change should feed your conversion metrics without manual entry.
Next, automate reminders and follow-ups tied to aging stages. If a client has not responded to a submission, the dashboard should flag the delay and trigger follow-up work. Workflow automation is most useful when it protects momentum.
Then connect goals to behavior. Recruitment KPI and goal tracking should help managers see whether the team is on track without asking every recruiter for a manual update.
LinkedIn reports that talent acquisition professionals using generative AI say they save about 20% of their workweek on average LinkedIn, 2025. That saved time only turns into agency performance when your dashboard shows where recruiters should spend it.
How ATZ CRM Connects ATS, CRM, and Reporting Data
Agency reporting gets messy when candidate tracking lives in one tool, client history lives in another, and recruiter goals live in a spreadsheet. You end up debating which number is correct instead of fixing the bottleneck.
ATZ CRM is built around a unified Applicant Tracking System and recruitment CRM, so candidate movement, client communication, team goals, and reporting can sit in the same operating system.
That matters because a placement is rarely a single event. It is the result of job intake, sourcing, screening, submission, client feedback, interview coordination, offer management, and follow-up. Your dashboard should trace that path.
For a deeper strategic view, pair this dashboard approach with the recruitment analytics playbook and the recruiting funnel playbook. The dashboard shows what is happening. The playbooks help you decide what to improve.
Frequently Asked Questions
What should an agency recruiting dashboard include?
An agency recruiting dashboard should include pipeline conversion, time in stage, source quality, recruiter output, client response speed, offer acceptance, and placement revenue. For agencies, client feedback and revenue visibility matter as much as candidate movement.
How is a recruitment KPI dashboard different from a normal report?
A recruitment KPI dashboard supports live decisions. A normal report often summarizes past activity, while a dashboard should show what needs attention now.
Which recruitment metrics dashboard view should recruiters use daily?
Recruiters should use a daily view that shows follow-ups, stage aging, interviews, response rates, and candidates waiting on action. They should not need to dig through leadership metrics to decide what to do next.
Can a small agency build a recruiting dashboard?
Yes. Small agencies can start with pipeline movement, source quality, recruiter output, and client feedback speed. You do not need a large operations team to benefit from clean reporting.
How do dashboards improve recruiter accountability?
Dashboards make expectations visible. When recruiters and managers agree on the metrics that matter, coaching becomes more specific and less personal.
Build a Dashboard Your Recruiters Will Actually Use
The best analytics view is not the prettiest one. It is the one your team trusts enough to use every week.
Start with decisions, not charts. Decide what your recruiters, managers, and owners need to act on, then build the dashboard around those moments.
ATZ CRM helps agencies connect pipeline tracking, team goal tracking, client activity, and reporting in one place. Book a demo to see how your agency can turn scattered recruiting data into a dashboard that drives better placement decisions.