Job Statistics Overview gives you a performance view across job listings so you can compare hiring progress and evaluate job-level outcomes.
Quick Answer
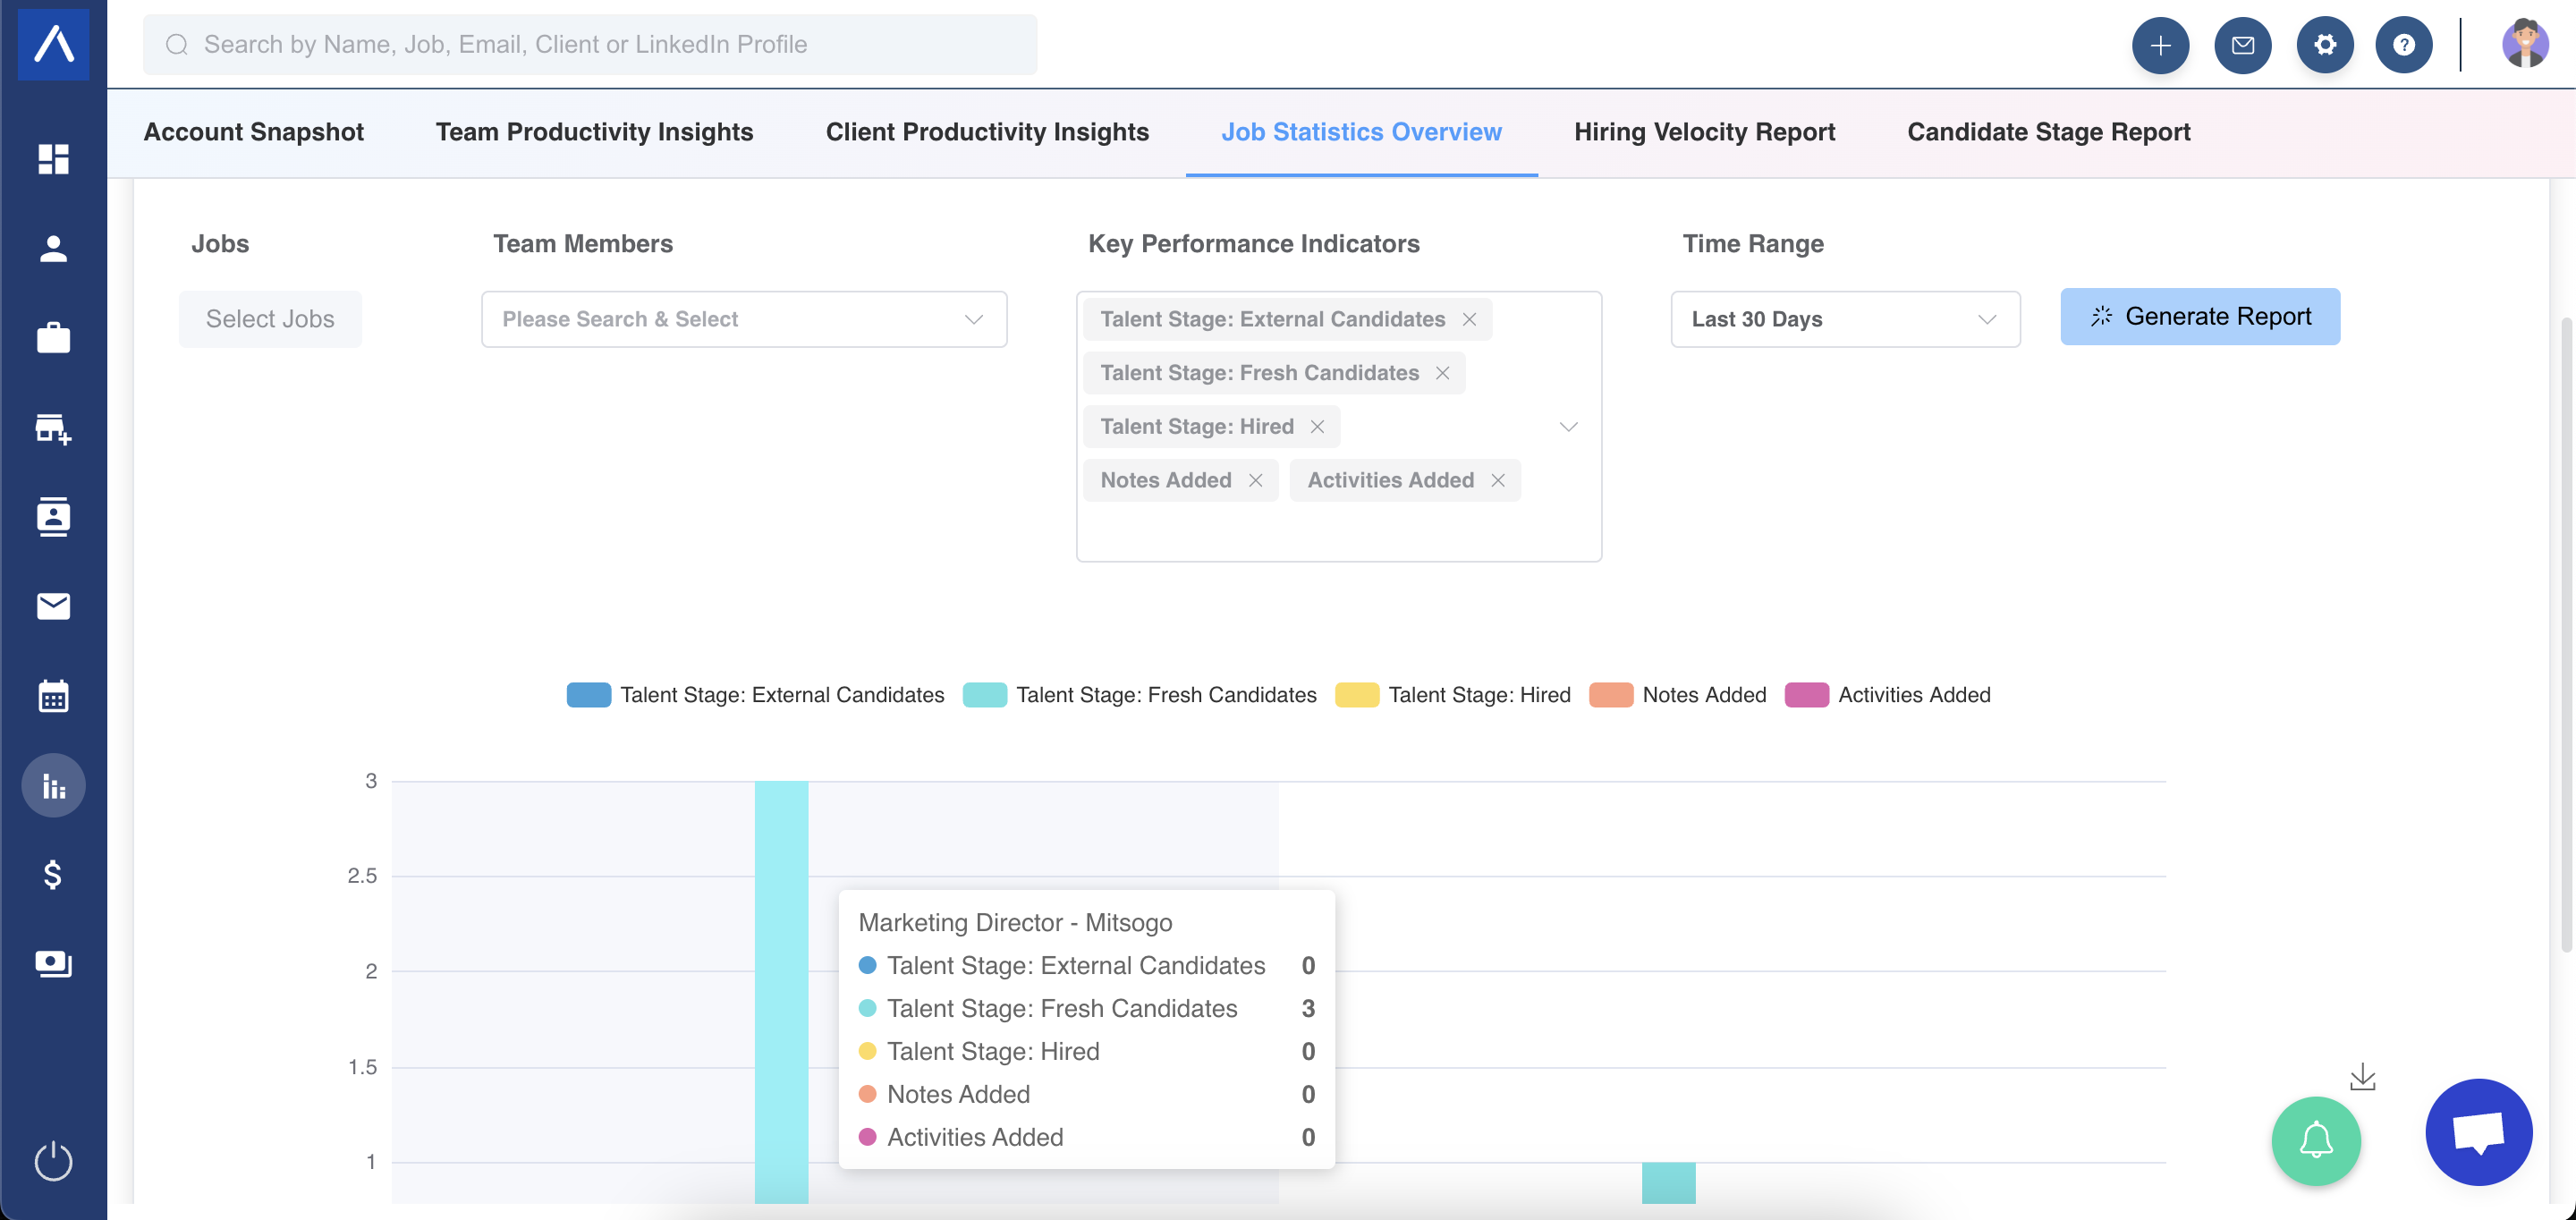
Select jobs, choose KPIs, set a time range, and click Generate Report. Use the charts to compare jobs and export applicant details when needed.
When to Use This Report
Use Job Statistics Overview to:
- Compare job performance.
- Identify top-performing or slow-moving jobs.
- Search for specific jobs.
- Export applicant names and current recruitment stages.
- Review whether job progress aligns with hiring goals.
Generate the Report
- Open Job Statistics Overview.
- Choose jobs from the dropdown.
- Select KPIs from the KPI dropdown.
- Set a time range.
- Click Generate Report.
Understand Historical Stage Data
Metrics related to hiring stages, such as External Candidate or Hired, are historical. Candidates were in those stages during the chosen date range, but their current stage may have changed.
Use Cases
Job Performance Review
Compare open jobs to see which ones are progressing and which need attention.
Applicant Export
Export applicant names and current stages for a selected job when you need an offline review.
Hiring Pipeline Diagnosis
Compare candidate movement across jobs to spot stuck or underperforming openings.
Troubleshooting
Export Data Looks Different from Chart Data
Charts may use historical stage data for the selected range, while exported applicant stages may show current recruitment stages.
Job Is Missing
Check the selected filters, date range, and whether you have permission to view that job.
Stage Counts Look Unexpected
Review the date range and remember that stage data is historical.
FAQs
Can I search for a specific job?
Yes. Use search to filter and select specific jobs.
Can I compare multiple jobs?
Yes. The report is designed to compare job listings.
Does the report use charts?
Yes. Selected KPI data appears in bar charts.